

技術研究所のまつけんです。
前回 (part 2) の続きです。前回は実際に、仙台近郊と福岡近郊の路線図を入力し、経路を生成してみました。今回は東京近郊です。例によって、路線図を隣接行列に変換します:
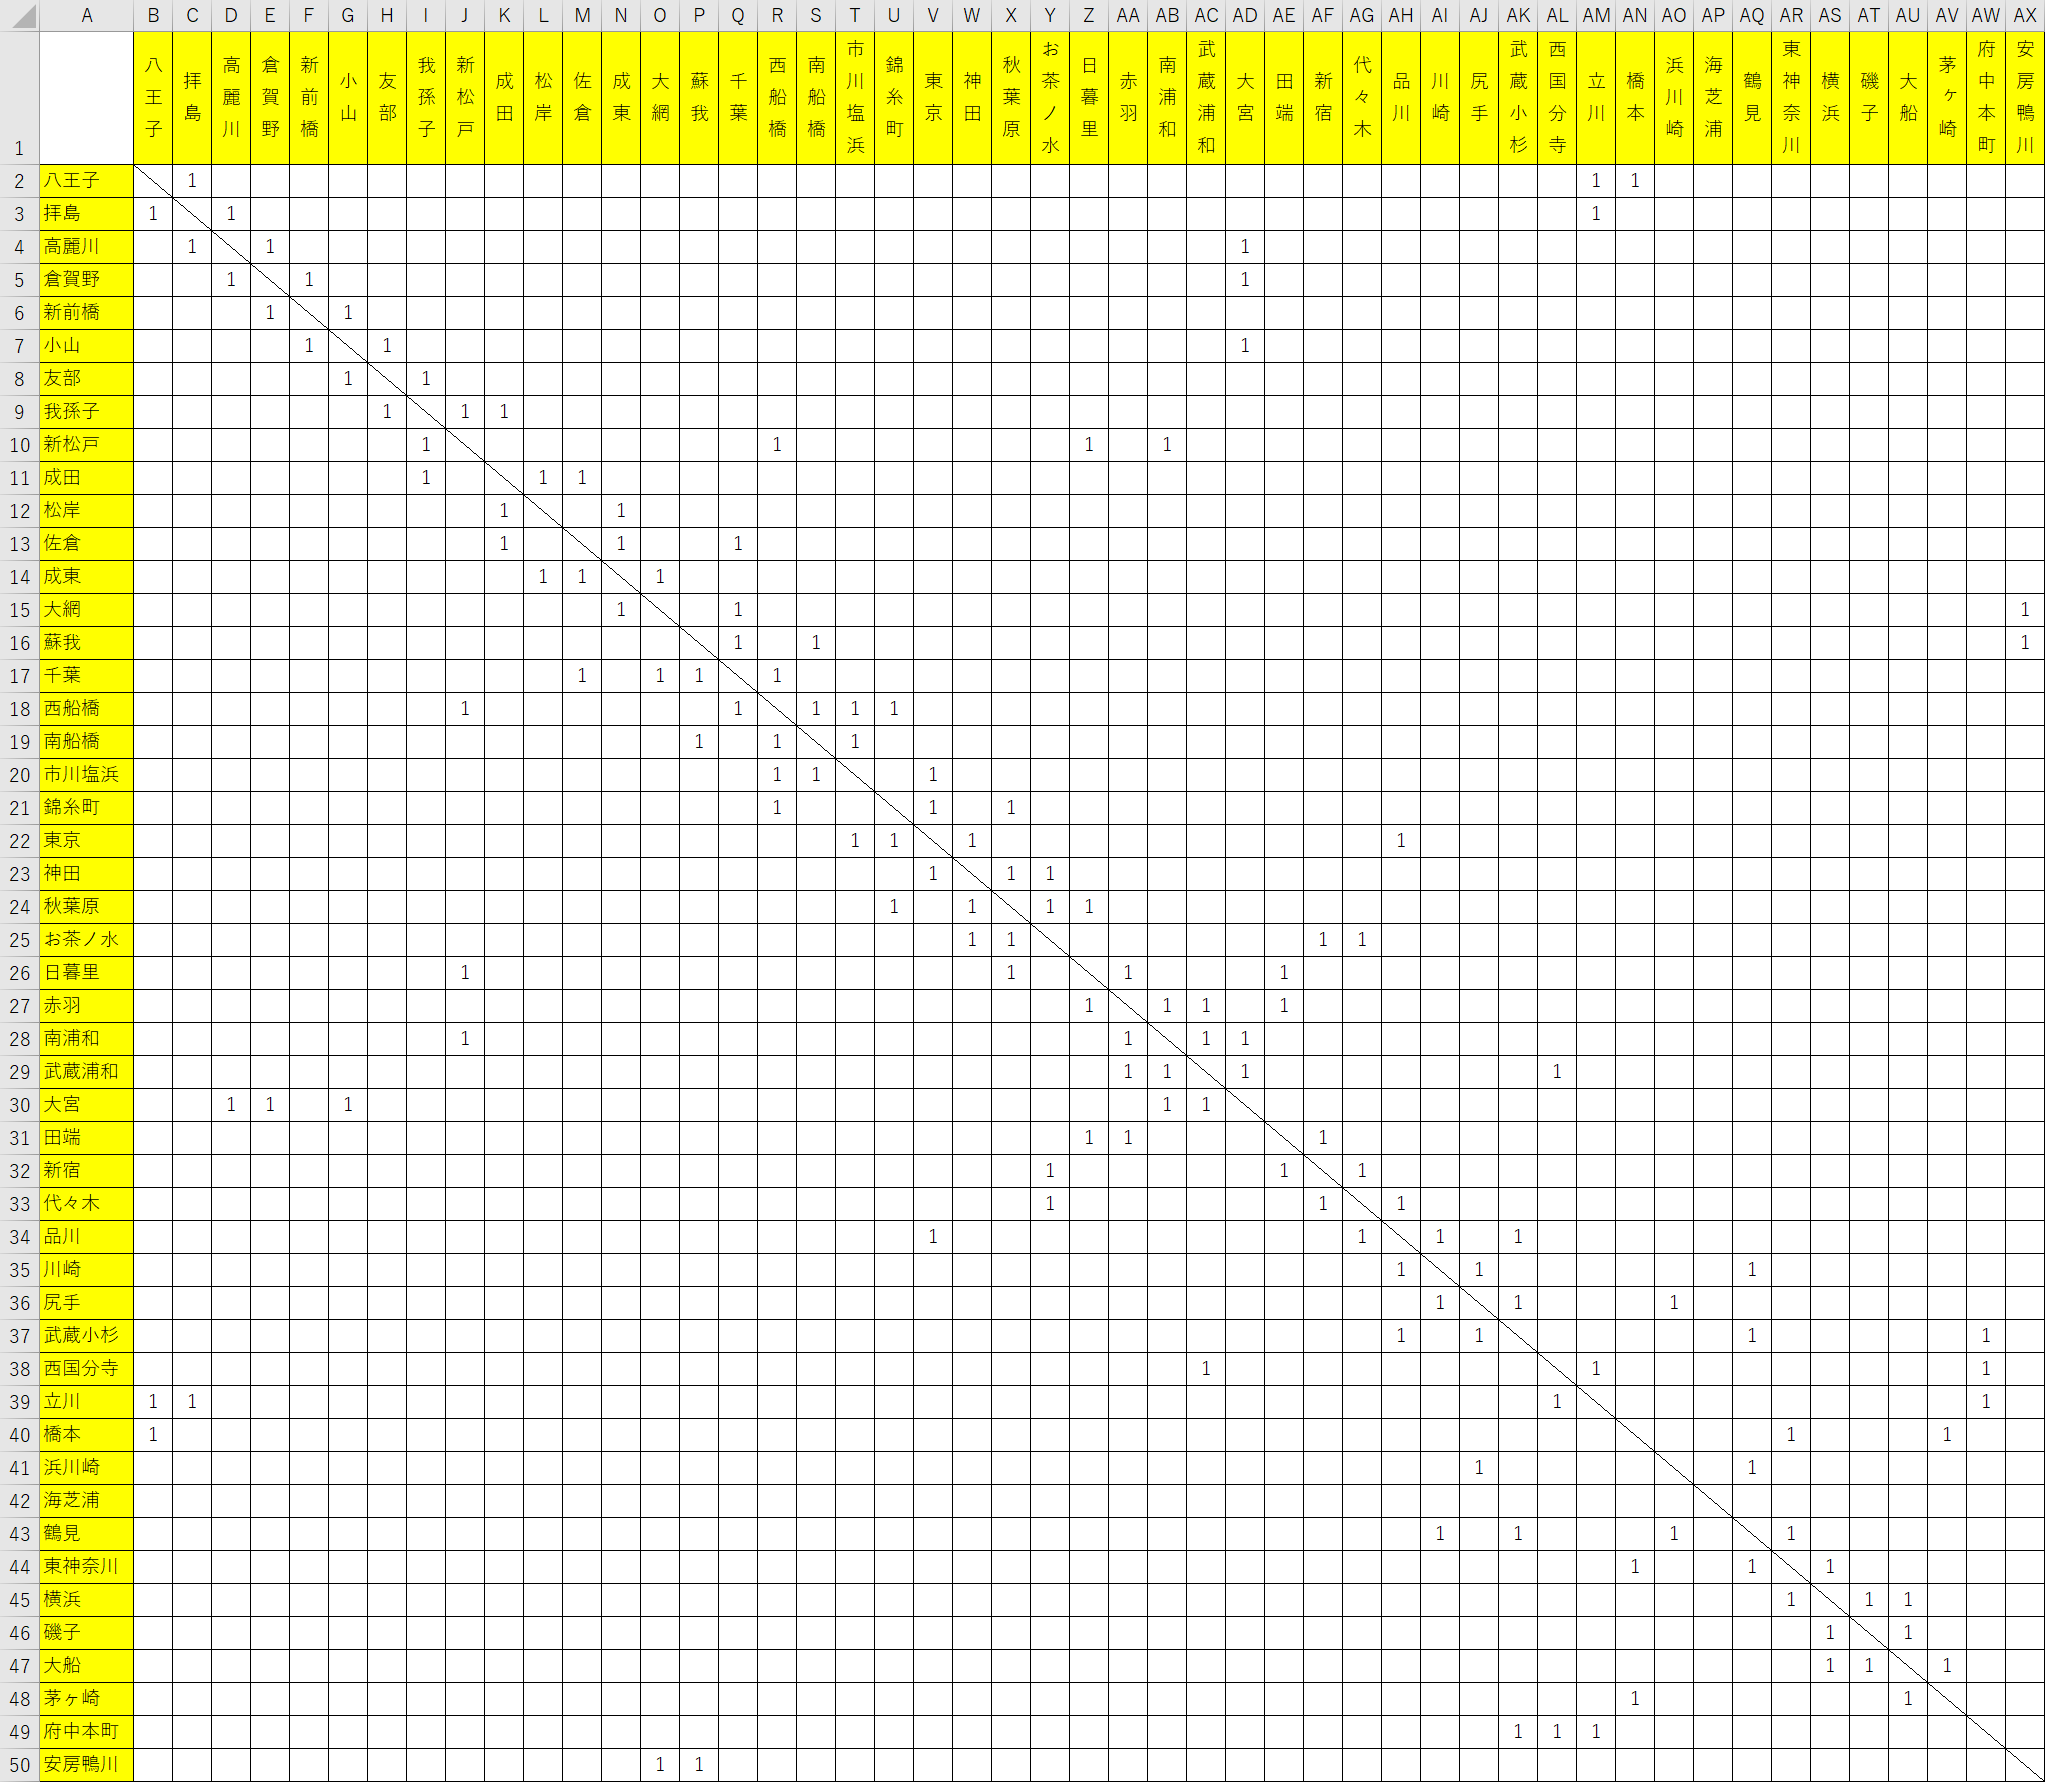
路線図から、この巨大な行列にどうやって変換したかというと・・・・手作業です。根性です。エンジニアと言えども時には根性で乗り切らなければならない場面もあるのです (笑)。そうは言ってもソフトウェアエンジニア魂がありますので、幾つかテクニックを駆使して手間を軽減しています。例えば、出来上がった隣接行列は必ず線対称になることがわかっているので、片方だけを入力すれば、もう一方は自動で補完できます。これは、以前に紹介したMATLAB/Octaveで簡単にできます。例えば、以下:
| >> A = [ |
| 0,1,1,0,0,0,0,0 ; |
| 0,0,0,0,0,0,0,0 ; |
| 0,0,0,1,0,0,0,0 ; |
| 0,0,0,0,1,0,0,0 ; |
| 0,0,0,1,0,1,0,0 ; |
| 0,0,0,1,1,0,0,0 ; |
| 0,0,0,0,1,1,0,0 ; |
| 0,0,1,1,0,0,0,0 ; |
| ]; |
| >> B = A + A'; |
| >> B(0 < B) = 1; |
のようにすることで、Aという8×8行列を定義して、それを線対称にすることが出来ます。また、線対称になったことを確認するには
| >> sum(abs(B - B')(:)) |
| ans = 0 |
の結果がゼロになっていることを確認します。ちなみに、Python + NumPyでも同じことが出来ます:
| numpy as np |
| A = np.array([ |
| [0,1,1,0,0,0,0,0], |
| [0,0,0,0,0,0,0,0], |
| [0,0,0,1,0,0,0,0], |
| [0,0,0,0,1,0,0,0], |
| [0,0,0,1,0,1,0,0], |
| [0,0,0,1,1,0,0,0], |
| [0,0,0,0,1,1,0,0], |
| [0,0,1,1,0,0,0,0], |
| ]) |
| B = A + A.T |
| B[np.where(0 < B)] = 1 |
| print(B) |
| np.sum(abs(B - B.T)) |
さて、このようにして出来た隣接行列のCSVファイル:
| 八王子,拝島,高麗川,倉賀野,新前橋,小山,友部,我孫子,新松戸,成田,松岸,佐倉,成東,大網,蘇我,千葉,西船橋,南船橋,市川塩浜,錦糸町,東京,神田,秋葉原,お茶ノ水,日暮里,赤羽,南浦和,武蔵浦和,大宮,田端,新宿,代々木,品川,川崎,尻手,武蔵小杉,西国分寺,立川,橋本,浜川崎,海芝浦,鶴見,東神奈川,横浜,磯子,大船,茅ヶ崎,府中本町,安房鴨川 |
| *,1,0,0,0,0,0,0,0,0,0,0,0,0,0,0,0,0,0,0,0,0,0,0,0,0,0,0,0,0,0,0,0,0,0,0,0,1,1,0,0,0,0,0,0,0,0,0,0 |
| 1,*,1,0,0,0,0,0,0,0,0,0,0,0,0,0,0,0,0,0,0,0,0,0,0,0,0,0,0,0,0,0,0,0,0,0,0,1,0,0,0,0,0,0,0,0,0,0,0 |
| 0,1,*,1,0,0,0,0,0,0,0,0,0,0,0,0,0,0,0,0,0,0,0,0,0,0,0,0,1,0,0,0,0,0,0,0,0,0,0,0,0,0,0,0,0,0,0,0,0 |
| 0,0,1,*,1,0,0,0,0,0,0,0,0,0,0,0,0,0,0,0,0,0,0,0,0,0,0,0,1,0,0,0,0,0,0,0,0,0,0,0,0,0,0,0,0,0,0,0,0 |
| 0,0,0,1,*,1,0,0,0,0,0,0,0,0,0,0,0,0,0,0,0,0,0,0,0,0,0,0,0,0,0,0,0,0,0,0,0,0,0,0,0,0,0,0,0,0,0,0,0 |
| 0,0,0,0,1,*,1,0,0,0,0,0,0,0,0,0,0,0,0,0,0,0,0,0,0,0,0,0,1,0,0,0,0,0,0,0,0,0,0,0,0,0,0,0,0,0,0,0,0 |
| 0,0,0,0,0,1,*,1,0,0,0,0,0,0,0,0,0,0,0,0,0,0,0,0,0,0,0,0,0,0,0,0,0,0,0,0,0,0,0,0,0,0,0,0,0,0,0,0,0 |
| 0,0,0,0,0,0,1,*,1,1,0,0,0,0,0,0,0,0,0,0,0,0,0,0,0,0,0,0,0,0,0,0,0,0,0,0,0,0,0,0,0,0,0,0,0,0,0,0,0 |
| 0,0,0,0,0,0,0,1,*,0,0,0,0,0,0,0,1,0,0,0,0,0,0,0,1,0,1,0,0,0,0,0,0,0,0,0,0,0,0,0,0,0,0,0,0,0,0,0,0 |
| 0,0,0,0,0,0,0,1,0,*,1,1,0,0,0,0,0,0,0,0,0,0,0,0,0,0,0,0,0,0,0,0,0,0,0,0,0,0,0,0,0,0,0,0,0,0,0,0,0 |
| 0,0,0,0,0,0,0,0,0,1,*,0,1,0,0,0,0,0,0,0,0,0,0,0,0,0,0,0,0,0,0,0,0,0,0,0,0,0,0,0,0,0,0,0,0,0,0,0,0 |
| 0,0,0,0,0,0,0,0,0,1,0,*,1,0,0,1,0,0,0,0,0,0,0,0,0,0,0,0,0,0,0,0,0,0,0,0,0,0,0,0,0,0,0,0,0,0,0,0,0 |
| 0,0,0,0,0,0,0,0,0,0,1,1,*,1,0,0,0,0,0,0,0,0,0,0,0,0,0,0,0,0,0,0,0,0,0,0,0,0,0,0,0,0,0,0,0,0,0,0,0 |
| 0,0,0,0,0,0,0,0,0,0,0,0,1,*,0,1,0,0,0,0,0,0,0,0,0,0,0,0,0,0,0,0,0,0,0,0,0,0,0,0,0,0,0,0,0,0,0,0,1 |
| 0,0,0,0,0,0,0,0,0,0,0,0,0,0,*,1,0,1,0,0,0,0,0,0,0,0,0,0,0,0,0,0,0,0,0,0,0,0,0,0,0,0,0,0,0,0,0,0,1 |
| 0,0,0,0,0,0,0,0,0,0,0,1,0,1,1,*,1,0,0,0,0,0,0,0,0,0,0,0,0,0,0,0,0,0,0,0,0,0,0,0,0,0,0,0,0,0,0,0,0 |
| 0,0,0,0,0,0,0,0,1,0,0,0,0,0,0,1,*,1,1,1,0,0,0,0,0,0,0,0,0,0,0,0,0,0,0,0,0,0,0,0,0,0,0,0,0,0,0,0,0 |
| 0,0,0,0,0,0,0,0,0,0,0,0,0,0,1,0,1,*,1,0,0,0,0,0,0,0,0,0,0,0,0,0,0,0,0,0,0,0,0,0,0,0,0,0,0,0,0,0,0 |
| 0,0,0,0,0,0,0,0,0,0,0,0,0,0,0,0,1,1,*,0,1,0,0,0,0,0,0,0,0,0,0,0,0,0,0,0,0,0,0,0,0,0,0,0,0,0,0,0,0 |
| 0,0,0,0,0,0,0,0,0,0,0,0,0,0,0,0,1,0,0,*,1,0,1,0,0,0,0,0,0,0,0,0,0,0,0,0,0,0,0,0,0,0,0,0,0,0,0,0,0 |
| 0,0,0,0,0,0,0,0,0,0,0,0,0,0,0,0,0,0,1,1,*,1,0,0,0,0,0,0,0,0,0,0,1,0,0,0,0,0,0,0,0,0,0,0,0,0,0,0,0 |
| 0,0,0,0,0,0,0,0,0,0,0,0,0,0,0,0,0,0,0,0,1,*,1,1,0,0,0,0,0,0,0,0,0,0,0,0,0,0,0,0,0,0,0,0,0,0,0,0,0 |
| 0,0,0,0,0,0,0,0,0,0,0,0,0,0,0,0,0,0,0,1,0,1,*,1,1,0,0,0,0,0,0,0,0,0,0,0,0,0,0,0,0,0,0,0,0,0,0,0,0 |
| 0,0,0,0,0,0,0,0,0,0,0,0,0,0,0,0,0,0,0,0,0,1,1,*,0,0,0,0,0,0,1,1,0,0,0,0,0,0,0,0,0,0,0,0,0,0,0,0,0 |
| 0,0,0,0,0,0,0,0,1,0,0,0,0,0,0,0,0,0,0,0,0,0,1,0,*,1,0,0,0,1,0,0,0,0,0,0,0,0,0,0,0,0,0,0,0,0,0,0,0 |
| 0,0,0,0,0,0,0,0,0,0,0,0,0,0,0,0,0,0,0,0,0,0,0,0,1,*,1,1,0,1,0,0,0,0,0,0,0,0,0,0,0,0,0,0,0,0,0,0,0 |
| 0,0,0,0,0,0,0,0,1,0,0,0,0,0,0,0,0,0,0,0,0,0,0,0,0,1,*,1,1,0,0,0,0,0,0,0,0,0,0,0,0,0,0,0,0,0,0,0,0 |
| 0,0,0,0,0,0,0,0,0,0,0,0,0,0,0,0,0,0,0,0,0,0,0,0,0,1,1,*,1,0,0,0,0,0,0,0,1,0,0,0,0,0,0,0,0,0,0,0,0 |
| 0,0,1,1,0,1,0,0,0,0,0,0,0,0,0,0,0,0,0,0,0,0,0,0,0,0,1,1,*,0,0,0,0,0,0,0,0,0,0,0,0,0,0,0,0,0,0,0,0 |
| 0,0,0,0,0,0,0,0,0,0,0,0,0,0,0,0,0,0,0,0,0,0,0,0,1,1,0,0,0,*,1,0,0,0,0,0,0,0,0,0,0,0,0,0,0,0,0,0,0 |
| 0,0,0,0,0,0,0,0,0,0,0,0,0,0,0,0,0,0,0,0,0,0,0,1,0,0,0,0,0,1,*,1,0,0,0,0,0,0,0,0,0,0,0,0,0,0,0,0,0 |
| 0,0,0,0,0,0,0,0,0,0,0,0,0,0,0,0,0,0,0,0,0,0,0,1,0,0,0,0,0,0,1,*,1,0,0,0,0,0,0,0,0,0,0,0,0,0,0,0,0 |
| 0,0,0,0,0,0,0,0,0,0,0,0,0,0,0,0,0,0,0,0,1,0,0,0,0,0,0,0,0,0,0,1,*,1,0,1,0,0,0,0,0,0,0,0,0,0,0,0,0 |
| 0,0,0,0,0,0,0,0,0,0,0,0,0,0,0,0,0,0,0,0,0,0,0,0,0,0,0,0,0,0,0,0,1,*,1,0,0,0,0,0,0,1,0,0,0,0,0,0,0 |
| 0,0,0,0,0,0,0,0,0,0,0,0,0,0,0,0,0,0,0,0,0,0,0,0,0,0,0,0,0,0,0,0,0,1,*,1,0,0,0,1,0,0,0,0,0,0,0,0,0 |
| 0,0,0,0,0,0,0,0,0,0,0,0,0,0,0,0,0,0,0,0,0,0,0,0,0,0,0,0,0,0,0,0,1,0,1,*,0,0,0,0,0,1,0,0,0,0,0,1,0 |
| 0,0,0,0,0,0,0,0,0,0,0,0,0,0,0,0,0,0,0,0,0,0,0,0,0,0,0,1,0,0,0,0,0,0,0,0,*,1,0,0,0,0,0,0,0,0,0,1,0 |
| 1,1,0,0,0,0,0,0,0,0,0,0,0,0,0,0,0,0,0,0,0,0,0,0,0,0,0,0,0,0,0,0,0,0,0,0,1,*,0,0,0,0,0,0,0,0,0,1,0 |
| 1,0,0,0,0,0,0,0,0,0,0,0,0,0,0,0,0,0,0,0,0,0,0,0,0,0,0,0,0,0,0,0,0,0,0,0,0,0,*,0,0,0,1,0,0,0,1,0,0 |
| 0,0,0,0,0,0,0,0,0,0,0,0,0,0,0,0,0,0,0,0,0,0,0,0,0,0,0,0,0,0,0,0,0,0,1,0,0,0,0,*,0,1,0,0,0,0,0,0,0 |
| 0,0,0,0,0,0,0,0,0,0,0,0,0,0,0,0,0,0,0,0,0,0,0,0,0,0,0,0,0,0,0,0,0,0,0,0,0,0,0,0,*,0,0,0,0,0,0,0,0 |
| 0,0,0,0,0,0,0,0,0,0,0,0,0,0,0,0,0,0,0,0,0,0,0,0,0,0,0,0,0,0,0,0,0,1,0,1,0,0,0,1,0,*,1,0,0,0,0,0,0 |
| 0,0,0,0,0,0,0,0,0,0,0,0,0,0,0,0,0,0,0,0,0,0,0,0,0,0,0,0,0,0,0,0,0,0,0,0,0,0,1,0,0,1,*,1,0,0,0,0,0 |
| 0,0,0,0,0,0,0,0,0,0,0,0,0,0,0,0,0,0,0,0,0,0,0,0,0,0,0,0,0,0,0,0,0,0,0,0,0,0,0,0,0,0,1,*,1,1,0,0,0 |
| 0,0,0,0,0,0,0,0,0,0,0,0,0,0,0,0,0,0,0,0,0,0,0,0,0,0,0,0,0,0,0,0,0,0,0,0,0,0,0,0,0,0,0,1,*,1,0,0,0 |
| 0,0,0,0,0,0,0,0,0,0,0,0,0,0,0,0,0,0,0,0,0,0,0,0,0,0,0,0,0,0,0,0,0,0,0,0,0,0,0,0,0,0,0,1,1,*,1,0,0 |
| 0,0,0,0,0,0,0,0,0,0,0,0,0,0,0,0,0,0,0,0,0,0,0,0,0,0,0,0,0,0,0,0,0,0,0,0,0,0,1,0,0,0,0,0,0,1,*,0,0 |
| 0,0,0,0,0,0,0,0,0,0,0,0,0,0,0,0,0,0,0,0,0,0,0,0,0,0,0,0,0,0,0,0,0,0,0,1,1,1,0,0,0,0,0,0,0,0,0,*,0 |
| 0,0,0,0,0,0,0,0,0,0,0,0,0,1,1,0,0,0,0,0,0,0,0,0,0,0,0,0,0,0,0,0,0,0,0,0,0,0,0,0,0,0,0,0,0,0,0,0,* |
を入力できるように、ソフトウェアを改造します。また、探索結果が膨大な数になることがわかっているので、最大乗り換え回数 max_transfers を設定できるようにします。改造後のプログラムは以下の通りです:
| #include <algorithm> |
| #include <iostream> |
| #include <fstream> |
| #include <string> |
| #include <sstream> |
| #include <map> |
| #include <vector> |
| using namespace std; |
| static int read_data( |
| const string & path, |
| vector<string> & station_vec, |
| map<string, int> & station_map, |
| vector<vector<int>> & matrix |
| ) { |
| ifstream ifs(path); |
| if (!ifs.is_open()) { |
| return -1; |
| } |
| string line; |
| // read legends |
| getline(ifs, line); |
| istringstream s(line); |
| int n = 0; |
| string token; |
| while (getline(s, token, ',')) { |
| station_vec.push_back(token); |
| station_map[token] = n++; |
| } |
| // read data |
| while (getline(ifs, line)) { |
| istringstream s(line); |
| string token; |
| vector<int> row; |
| while (getline(s, token, ',')) { |
| if (("*" != token) && ("" != token)) { |
| row.push_back(stoi(token)); |
| } else { |
| row.push_back(0); |
| } |
| } |
| while (row.size() < station_vec.size()) { |
| row.push_back(0); |
| } |
| matrix.push_back(row); |
| } |
| return 0; |
| } |
| void search_routes( |
| const vector<vector<int>> & matrix, |
| const int n, |
| const int max_transfers, |
| vector<int> route, |
| vector<vector<int>> & routes |
| ) { |
| if (max_transfers + 1 < route.size()) { |
| return; |
| } |
| if (2 < route.size() && route[0] == n) { |
| route.push_back(n); |
| routes.push_back(route); |
| return; |
| } |
| if (0 < route.size() && route[route.size() - 1] == n) { |
| return; |
| } |
| if (find(route.begin(), route.end(), n) != route.end()) { |
| return; |
| } |
| route.push_back(n); |
| for (int i = 0; i < (int)matrix[n].size(); i++) { |
| if (0 < matrix[n][i]) { |
| search_routes( |
| matrix, |
| i, |
| max_transfers, |
| route, |
| routes); |
| } |
| } |
| } |
| int main(const int argc, const char*const argv[]) |
| { |
| vector<string> station_vec; |
| map<string, int> station_map; |
| vector<vector<int>> matrix; |
| if (argc <= 1) { |
| cerr << "Too few args." << endl; |
| return EXIT_FAILURE; |
| } |
| // read adjacency matrix |
| if (read_data(argv[1], station_vec, station_map, matrix) < 0) { |
| cerr << "File open error." << endl; |
| return EXIT_FAILURE; |
| } |
| int max_transfers = 10; |
| if (3 <= argc) { |
| max_transfers = atoi(argv[2]); |
| } |
| vector<int> starting_points; |
| if (4 <= argc) { |
| for (int i = 3; i < argc; i++) { |
| starting_points.push_back(station_map.at(argv[i])); |
| } |
| } else { |
| for (int i = 0; i < (int)station_vec.size(); i++) { |
| starting_points.push_back(i); |
| } |
| } |
| vector<vector<int>> routes; |
| for (int i : starting_points) { |
| vector<int> route; |
| search_routes(matrix, i, max_transfers, route, routes); |
| } |
| for (auto route : routes) { |
| for (int n : route) { |
| cout << station_vec[n] << ","; |
| } |
| cout << endl; |
| } |
| return EXIT_SUCCESS; |
| } |
さて、それでは実行してみましょう (g++でビルドできます)。乗り換え回数を5、10、および、15に制限して実行した結果です:
| $ ./a.out adj_mat_tokyo.csv 5 | wc -l |
| 488 |
| $ ./a.out adj_mat_tokyo.csv 10 | wc -l |
| 7720 |
| $ ./a.out adj_mat_tokyo.csv 15 | wc -l |
| 183078 |
もの凄い経路の数です。しかも、ここでいう「乗り換え回数」というのは現実世界のそれとは異なります。例えば、品川から山手線で日暮里まで行くだけでも、神田と秋葉原で乗り換えたという扱いになってしまいます。残念ながら、これでは実用に耐えませんね。この問題を解決するには、鉄道の路線情報などを組み込む必要がありますが、そこまでやると、「ちょっとした趣味」の範囲を逸脱してしまいますので、ひとまず、このくらいにしておきたいと思います。
それはそれとして、もう一つ問題があります。プログラムについては、簡単なテストを行っていますが、データ (路線図を隣接行列に変換したもの) については、まだ、テスト (確認作業) をしていません。根性で打ち込んだものの、行列と路線図を目視で確認するのは大変ですし、確認作業中にミスが発生しそうです。そこで、これについてもソフトウェアエンジニア魂を発揮してみたいと思います。
隣接行列を再び路線図の形に戻せれば、確認作業がやりやすいはずです。路線図を隣接行列に変換した時点で位置情報が失われてしまっていますから、位置情報を与えてやる必要があります。日本の駅の緯度と経度をダウンロードできるサイト[1]を見つけたのでそれを使いましょう。ダウンロードしたCSVファイルは全国版なので、JR東日本管内の緯度と経度だけを取り出します:
| $ grep JR東日本 station_latlon_utf8_20180611.csv | cut -d , -f 3,6,7 | sed -e 's/"//g' > jr_east.csv |
先に作成したCSV読み込みルーチンをそのまま使いたいので、ファイル全体を転置します。これについては、Excelなどで「行と列を入れ替えて張り付け」れば出来ます。転置したファイルをjr_east_T.csvとして保存します (なお、隣接行列の駅名に合わせて、茅ケ崎→茅ヶ崎、御茶ノ水→お茶ノ水に置換しました)。先のプログラムを改造して、隣接行列とjr_east_T.csvを読み込んで、路線図のSVGファイルを出力するプログラムを作成しました:
| #include <algorithm> |
| #include <iostream> |
| #include <fstream> |
| #include <string> |
| #include <sstream> |
| #include <map> |
| #include <vector> |
| using namespace std; |
| template<typename T> |
| static int read_data( |
| const string & path, |
| vector<string> & station_vec, |
| map<string, int> & station_map, |
| vector<vector<T>> & matrix |
| ) { |
| ifstream ifs(path); |
| if (!ifs.is_open()) { |
| return -1; |
| } |
| string line; |
| // read legends |
| getline(ifs, line); |
| istringstream s(line); |
| int n = 0; |
| string token; |
| while (getline(s, token, ',')) { |
| station_vec.push_back(token); |
| station_map[token] = n++; |
| } |
| // read data |
| while (getline(ifs, line)) { |
| istringstream s(line); |
| string token; |
| vector<T> row; |
| while (getline(s, token, ',')) { |
| if (("*" != token) && ("" != token) && ("0" != token)) { |
| row.push_back(stof(token)); |
| } else { |
| row.push_back(0); |
| } |
| } |
| while (row.size() < station_vec.size()) { |
| row.push_back(0); |
| } |
| matrix.push_back(row); |
| } |
| return 0; |
| } |
| int main(const int argc, const char*const argv[]) |
| { |
| vector<string> station_vec; |
| map<string, int> station_map; |
| vector<vector<int>> matrix; |
| vector<string> station_vec2; |
| map<string, int> station_map2; |
| vector<vector<double>> matrix2; |
| if (argc <= 1) { |
| cerr << "Too few args." << endl; |
| return EXIT_FAILURE; |
| } |
| // read adjacency matrix |
| if (read_data(argv[1], station_vec, station_map, matrix) < 0) { |
| cerr << "File open error." << endl; |
| return EXIT_FAILURE; |
| } |
| // read coordinates of stations |
| if (read_data("jr_east_T.csv", station_vec2, station_map2, matrix2) < 0) { |
| cerr << "File open error." << endl; |
| return EXIT_FAILURE; |
| } |
| // estimate max. and min. of latitude and longitude |
| double min_lat = 180., max_lat = 0.; |
| double min_lon = 180., max_lon = 0.; |
| for (auto station : station_vec){ |
| int idx = station_map2[station]; |
| min_lat = min(min_lat, matrix2[1][idx]); |
| max_lat = max(max_lat, matrix2[1][idx]); |
| min_lon = min(min_lon, matrix2[0][idx]); |
| max_lon = max(max_lon, matrix2[0][idx]); |
| } |
| const double scale = 1800.; |
| cout << R"###(<?xml version="1.0" encoding="utf-8"?> |
| <svg version="1.1" |
| xmlns="http://www.w3.org/2000/svg" |
| xmlns:xlink="http://www.w3.org/1999/xlink" |
| x="0px" y="0px" |
| )###" |
| << "viewBox=\"-100 -20 " |
| << (max_lat - min_lat) * scale + 100 |
| << " " |
| << (max_lon - min_lon) * scale + 20 |
| << "\" >" << endl; |
| // lines |
| for (int i = 0; i < (int)matrix.size(); i++) { |
| const string station_from = station_vec[i]; |
| const int idx_from = station_map2[station_from]; |
| for (int j = 0; j < (int)matrix[i].size(); j++) { |
| const string station_to = station_vec[j]; |
| const int idx_to = station_map2[station_to]; |
| if (0 < matrix[i][j]){ |
| cout |
| << "<line x1=\"" |
| << (matrix2[1][idx_from] - min_lat) * scale |
| << "\" y1=\"" |
| << (max_lon - matrix2[0][idx_from]) * scale |
| << "\" x2=\"" |
| << (matrix2[1][idx_to] - min_lat) * scale |
| << "\" y2=\"" |
| << (max_lon - matrix2[0][idx_to]) * scale |
| << "\" stroke=\"grey\" stroke-width=\"1\" />\t<!--\t" |
| << station_from << " => " << station_to << "\t-->" << endl; |
| } |
| } |
| } |
| // station names |
| for (auto station : station_vec){ |
| int idx = station_map2.at(station); |
| cout |
| << "<text transform=\"matrix(1 0 0 1 " |
| << (matrix2[1][idx] - min_lat) * scale |
| << " " |
| << (max_lon - matrix2[0][idx]) * scale |
| << ")\" font-size=\"8\" text-anchor=\"middle\">" |
| << station |
| << "</text>" |
| << endl; |
| } |
| cout << "</svg>" << endl; |
| return EXIT_SUCCESS; |
| } |
SVGファイルについては、[2]を参照していただければと思います。以下:
| $ ./a.out adj_mat_tokyo.csv > out.svg |
のように実行した結果が、こちらです:
| <?xml version="1.0" encoding="utf-8"?> |
| <svg version="1.1" |
| xmlns="http://www.w3.org/2000/svg" |
| xmlns:xlink="http://www.w3.org/1999/xlink" |
| x="0px" y="0px" |
| viewBox="-100 -20 3246.79 2308.65" > |
| <line x1="525.751" y1="1302.09" x2="533.798" y2="1183.78" stroke="grey" stroke-width="1" /> <!-- 八王子 => 拝島 --> |
| <line x1="525.751" y1="1302.09" x2="660.223" y2="1225.33" stroke="grey" stroke-width="1" /> <!-- 八王子 => 立川 --> |
| <line x1="525.751" y1="1302.09" x2="535.803" y2="1411.13" stroke="grey" stroke-width="1" /> <!-- 八王子 => 橋本 --> |
| <line x1="533.798" y1="1183.78" x2="525.751" y2="1302.09" stroke="grey" stroke-width="1" /> <!-- 拝島 => 八王子 --> |
| <line x1="533.798" y1="1183.78" x2="524.103" y2="868.696" stroke="grey" stroke-width="1" /> <!-- 拝島 => 高麗川 --> |
| <line x1="533.798" y1="1183.78" x2="660.223" y2="1225.33" stroke="grey" stroke-width="1" /> <!-- 拝島 => 立川 --> |
| <line x1="524.103" y1="868.696" x2="533.798" y2="1183.78" stroke="grey" stroke-width="1" /> <!-- 高麗川 => 拝島 --> |
| <line x1="524.103" y1="868.696" x2="4.58679" y2="141.696" stroke="grey" stroke-width="1" /> <!-- 高麗川 => 倉賀野 --> |
| (中略) |
| <line x1="871.573" y1="1845.85" x2="648.495" y2="1886.75" stroke="grey" stroke-width="1" /> <!-- 大船 => 茅ヶ崎 --> |
| <line x1="648.495" y1="1886.75" x2="535.803" y2="1411.13" stroke="grey" stroke-width="1" /> <!-- 茅ヶ崎 => 橋本 --> |
| <line x1="648.495" y1="1886.75" x2="871.573" y2="1845.85" stroke="grey" stroke-width="1" /> <!-- 茅ヶ崎 => 大船 --> |
| <line x1="774.399" y1="1283.7" x2="1102.89" y2="1444.04" stroke="grey" stroke-width="1" /> <!-- 府中本町 => 武蔵小杉 --> |
| <line x1="774.399" y1="1283.7" x2="754.321" y2="1222.54" stroke="grey" stroke-width="1" /> <!-- 府中本町 => 西国分寺 --> |
| <line x1="774.399" y1="1283.7" x2="660.223" y2="1225.33" stroke="grey" stroke-width="1" /> <!-- 府中本町 => 立川 --> |
| <line x1="1901.95" y1="2288.65" x2="2275.54" y2="1541.72" stroke="grey" stroke-width="1" /> <!-- 安房鴨川 => 大網 --> |
| <line x1="1901.95" y1="2288.65" x2="1950.92" y2="1434.37" stroke="grey" stroke-width="1" /> <!-- 安房鴨川 => 蘇我 --> |
| <text transform="matrix(1 0 0 1 525.751 1302.09)" font-size="8" text-anchor="middle">八王子</text> |
| <text transform="matrix(1 0 0 1 533.798 1183.78)" font-size="8" text-anchor="middle">拝島</text> |
| <text transform="matrix(1 0 0 1 524.103 868.696)" font-size="8" text-anchor="middle">高麗川</text> |
| <text transform="matrix(1 0 0 1 4.58679 141.696)" font-size="8" text-anchor="middle">倉賀野</text> |
| <text transform="matrix(1 0 0 1 0 0)" font-size="8" text-anchor="middle">新前橋</text> |
| <text transform="matrix(1 0 0 1 1366.78 119.14)" font-size="8" text-anchor="middle">小山</text> |
| <text transform="matrix(1 0 0 1 2266.89 51.0109)" font-size="8" text-anchor="middle">友部</text> |
| <text transform="matrix(1 0 0 1 1734.38 911.062)" font-size="8" text-anchor="middle">我孫子</text> |
| (中略) |
| <text transform="matrix(1 0 0 1 1132.61 1566.99)" font-size="8" text-anchor="middle">鶴見</text> |
| <text transform="matrix(1 0 0 1 1055.79 1621.62)" font-size="8" text-anchor="middle">東神奈川</text> |
| <text transform="matrix(1 0 0 1 1036.42 1642.94)" font-size="8" text-anchor="middle">横浜</text> |
| <text transform="matrix(1 0 0 1 1027.8 1762.3)" font-size="8" text-anchor="middle">磯子</text> |
| <text transform="matrix(1 0 0 1 871.573 1845.85)" font-size="8" text-anchor="middle">大船</text> |
| <text transform="matrix(1 0 0 1 648.495 1886.75)" font-size="8" text-anchor="middle">茅ヶ崎</text> |
| <text transform="matrix(1 0 0 1 774.399 1283.7)" font-size="8" text-anchor="middle">府中本町</text> |
| <text transform="matrix(1 0 0 1 1901.95 2288.65)" font-size="8" text-anchor="middle">安房鴨川</text> |
| </svg> |
生成されたSVGをPDFに変換したものが、こちらになります。早速、元の路線図と比べてみたのですが、思った通り、少なくとも間違いが3か所ありました。やはり、確認作業は大切ですね。なお、今回のように、データを作成したときとは別の方法で確認を行うと、ミスの発見が容易になりますね。
如何でしたでしょうか? 今回作成した座標データから図を生成するプログラムは何かと使えるかと思います (線の色や太さは「stroke=\”grey\” stroke-width=\”1\”」の部分を、文字サイズは「font-size=\”8\”」の部分で変更できます)。次回は、これを少し改良して、より見やすい図を生成できないか、検討したいと思います。それでは、また次回。
[1] 駅・路線、緯度経度データ等のダウンロード https://opendata-web.site/dl/
[2] https://ja.wikipedia.org/wiki/Scalable_Vector_Graphics